
EXECUTIVE SUMMARY
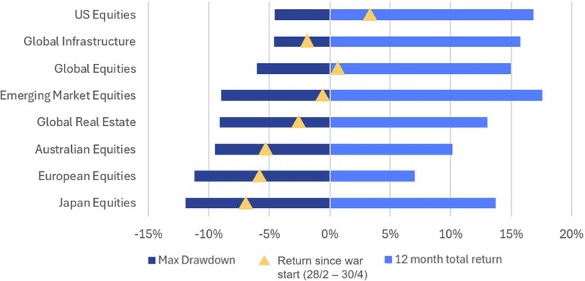
Equity markets have rebounded at different speeds, largely reflecting differences in index composition and exposure to the Middle East situation. US markets have reached record highs, driven by strong earnings in mega cap technology companies, with energy independence providing an added advantage.
MARKET UPDATE
Equity markets have rebounded at different speeds, largely reflecting differences in index composition and exposure to the Middle East situation. US markets have reached record highs, driven by strong earnings in mega cap technology companies, with energy independence providing an added advantage.
Australian market returns have been more subdued, as higher interest rates weigh on earnings expectations. A mix of growth-focused US and global shares with income-generating Australian equities continues to support balanced long-term returns. Australian bonds offer attractive returns of around 5–6% per annum, with relatively low credit risk.
April was dominated by headlines in the Middle East. A ceasefire supported a market rebound, although a lasting resolution remains uncertain. Energy prices remained elevated, underscoring inflation and supply risks.
US equities were the standout gaining +10.5%. Strong earnings, particularly across technology and financials, propelled markets back to record highs. The US is leading the world in the areas that matter most, AI and energy self-sufficiency.
Australian equities posted modest gains (+2.2%), reflecting a more cautious earnings outlook. Concerns around rising interest rates, stagflation (low growth and high inflation) and energy security weighed on investor sentiment.
This gap in performance across growth assets is shown in the chart below.
A global perspective on Australian equities
As regular readers of our investment updates would know, much of the content is focused on the US.
This is because the US sits at the centre of global financial markets, with developments often felt worldwide.
US markets account for about 60% of the total global equity market value.
Australia ranks 11th by size and has an approximate 2% weighting.
Some of the size comparisons are truly staggering:
The five largest US companies – Nvidia, Alphabet (Google), Apple, Microsoft and Amazon – are all individually larger than the entire value of the Australian equity market.
Nvidia is about 2.4x the size of the Australian equity market.
If listed on US markets, Australia’s largest company, Commonwealth Bank would rank about 50th by market value.
Australian investors are typically very overweight Australian equities relative to their share of the global market.
Investors naturally gravitate towards companies they know best, a tendency known as “home bias”.
A “houses and holes” economy and equity market
Global investors have long viewed Australia as an economically sensitive region whose fortunes are pinned to the demand for its commodity exports and property.
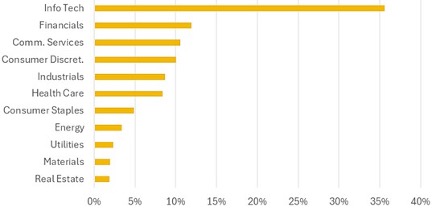
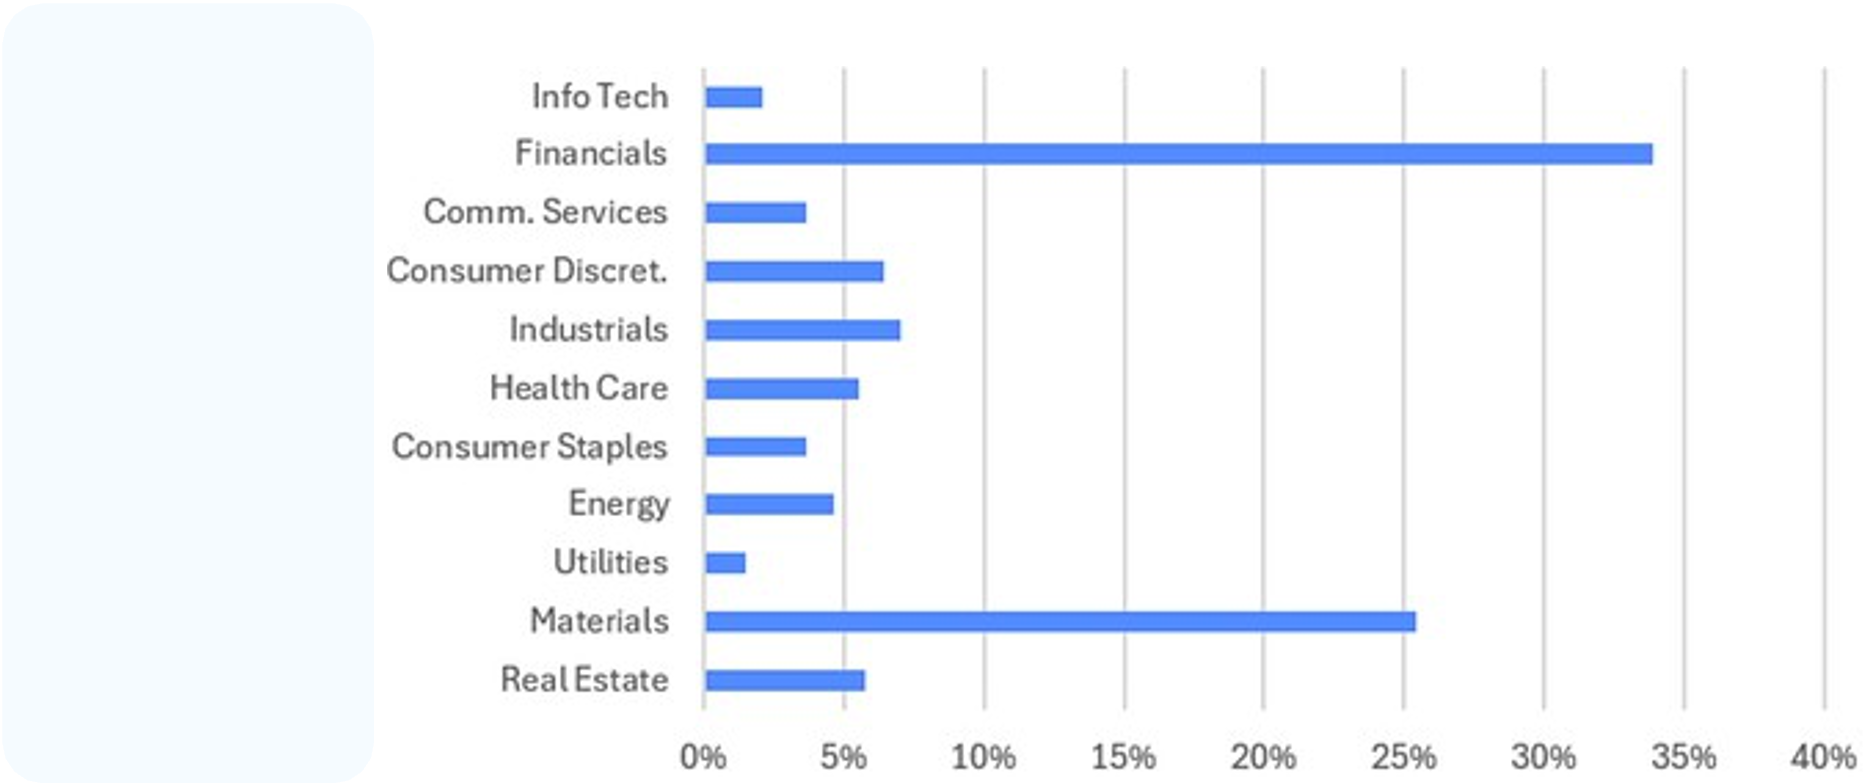
The Australian equities market composition reflects this perception. Over half of the stock market’s value resides in the Financials (e.g. CBA, NAB, WBC, ANZ) and Materials (e.g. BHP, RIO, FMG) sectors.
This is quite different from what you find in major US and global market indices. Australia is overweight in Financials & Materials and Underweight in Technology. The latter is a key reason for the recent underperformance relative to US and global markets.
Australian earnings have been more volatile and grown less over time
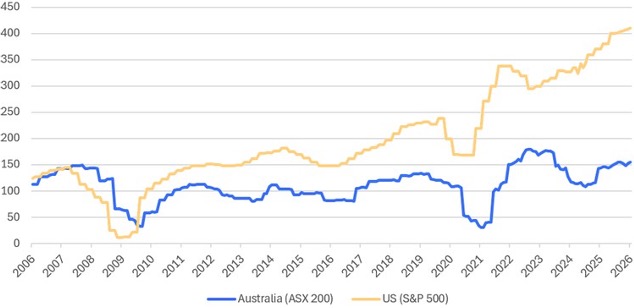
The chart below shows how both Australian and US earnings have moved through major cycles, including the Global Financial Crisis and the pandemic. While both were impacted, the longer-term trend is very different.
Australian company earnings have largely moved sideways. This reflects a market dominated by mature, cyclical sectors, where companies pay higher dividends and reinvest less into growth.
As a result, Australian company earnings are more sensitive to economic conditions and are currently under pressure as cost-of-living constraints weigh on demand.
A resolution to the Middle East conflict, would be particularly beneficial for Australian equities (helping ease inflation and interest rate risks).
By contrast, the US market has greater exposure to structural growth sectors, particularly technology. Companies tend to reinvest more of their earnings, supporting stronger and more consistent growth over time.
These differences highlight the value of diversification, with Australian equities providing income and global equities driving growth.
EARNINGS TRAJECTORIES OVER THE PAST TWO DECADES
Australian consumer sentiment sours
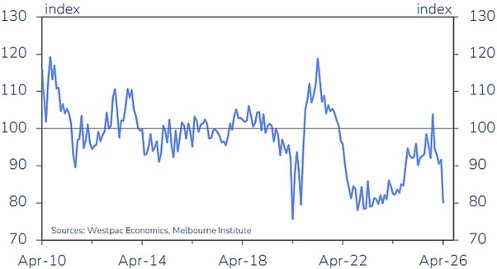
Australian consumers are under pressure facing both higher fuel prices and higher interest rates. This cost-of-living shock is putting household budgets under growing strain. The Westpac-Melbourne Institute’s April Consumer Sentiment report painted a bleak picture:
The Index fell 12.5% to 80.1 from 91.6 in March, its biggest monthly drop since the onset of COVID. Near-term expectations have fallen back to 2022-23 lows. Job-loss fears have risen to a 5.5 year high (10 year high excluding the COVID period) Consumers are much less bullish on the house price outlook. We note Westpac and NAB have both recently increased credit (bad debt) provisions reflecting a more challenging economic outlook.
CONSUMER SENTIMENT INDEX
Bond yields are attractive
Bond returns are driven by two key components:
Bond yields – the level of interest rates.
Credit risk – the additional return compensating investors for default risk.
The risk-free yield on a 5-year Australian Government bond is around 4.8%, its highest level in 15 years.
AUSTRALIAN 5 YEAR GOVERNMENT BOND YEILD
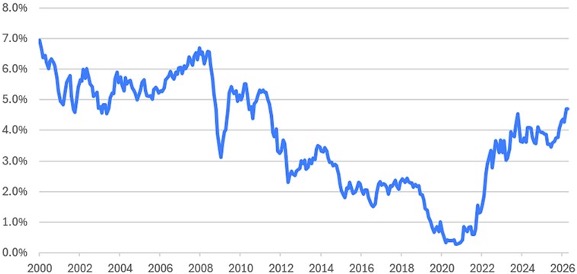
This gives investors to chance to earn 5–6% p.a. with limited credit risk, providing a strong foundation for bond portfolios.
Preferred floating rate exposures:
Van Eck Australian Floating Rate ETF (ASX: FLOT): AA- rating, 4.9% yield
Van Eck Australian Subordinated Debt ETF (ASX: SUBD): A- rating, 5.5% yield
Preferred fixed rate exposures:
BetaShares Australian Composite Bond ETF (ASX: OZBD): AA- rating, 5.3% yield to maturity.
Coolabah Active Composite Bond Complex ETF (ASX: FIXD): AA- rating, 5.5% yield.
Vanguard Australian Corporate Fixed Interest ETF (ASX: VACF): A+ rating, 5.3% yield to maturity.
VanEck Australian Fixed Rate Subordinated Debt ETF (ASX: FSUB): A- rating, 5.8% yield to maturity.
*Yields shown above are net of management fees.
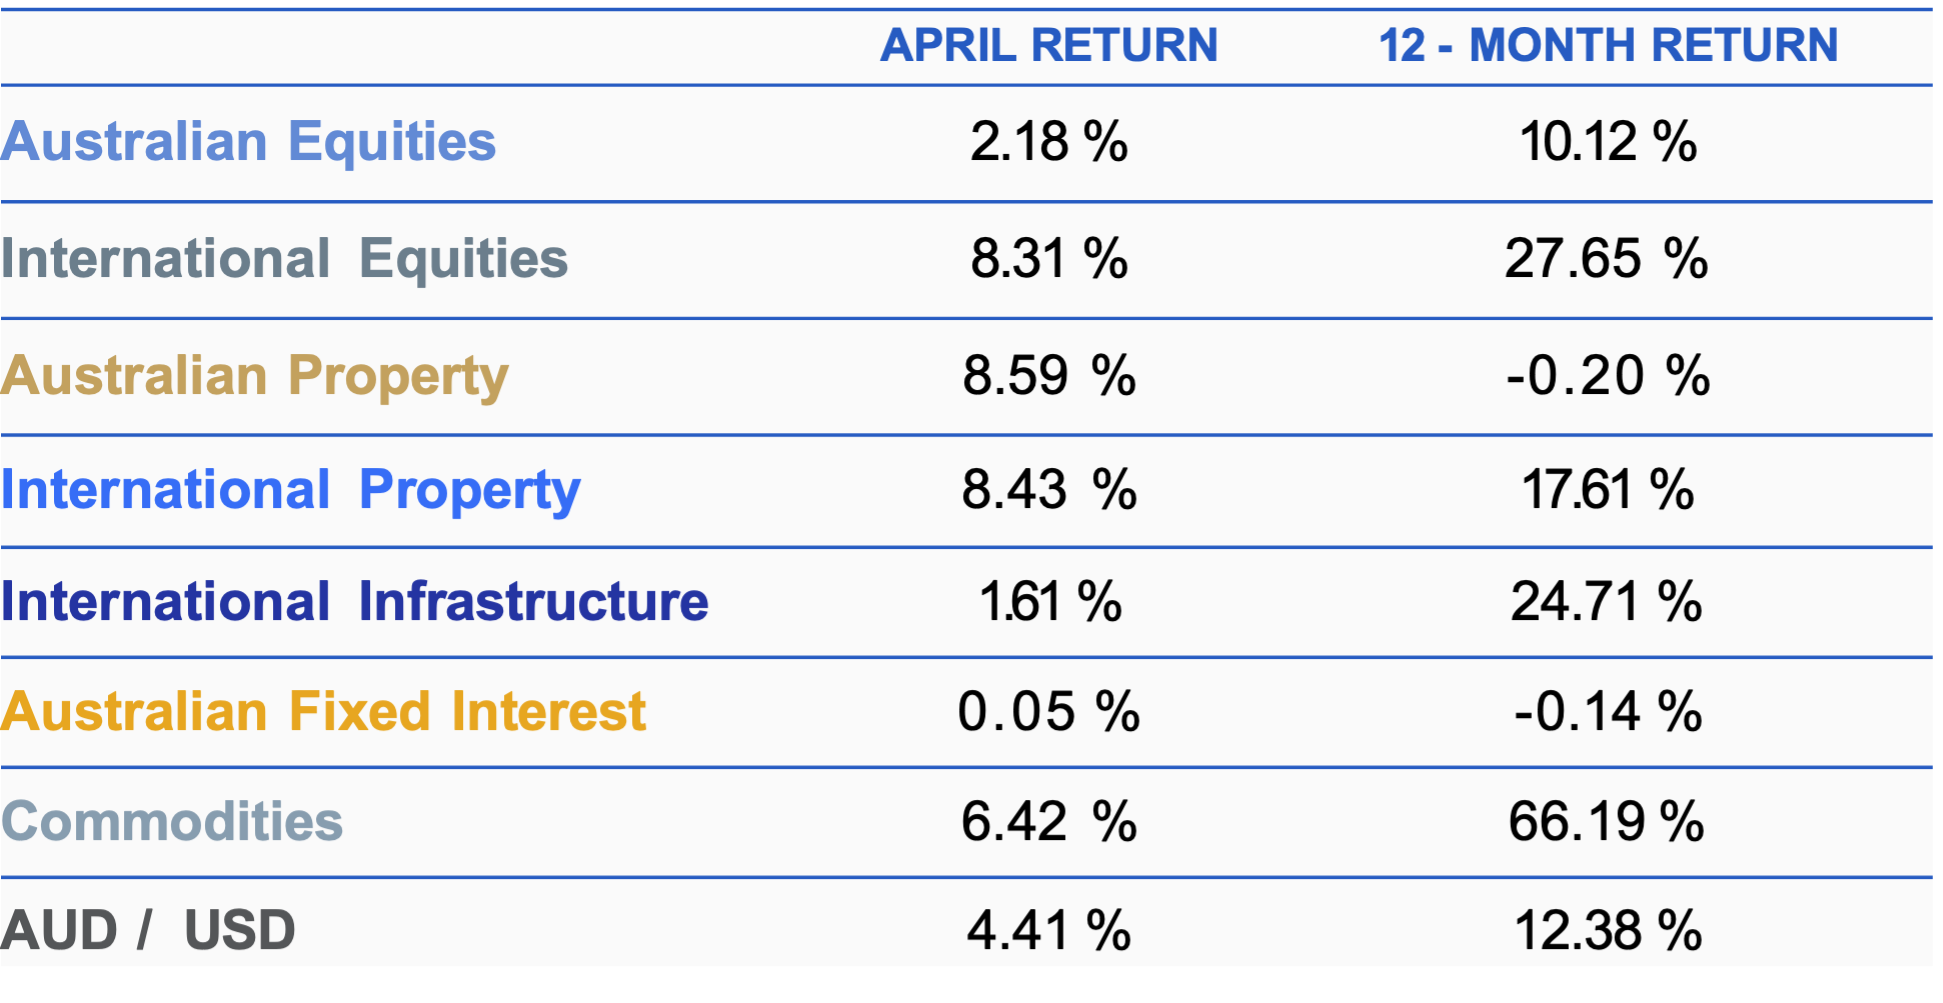
ASSET CLASS PERFORMANCE
AUSTRALIAN EQUITIES
The S&P/ASX 200 Index saw a strong rally early, but this was largely unwound later in the month, with the Australian market finishing April up +2.2%.
Information Technology (+13.3%) was the strongest sector as sentiment improved towards global tech.
A-REITs (+8.6%) also had a strong month, recovering much of March’s decline.
Healthcare (-8.7%) was the weakest sector, mainly due to Cochlear’s sharp share price drop (-44%) after an earnings downgrade.
Consumer Staples (-4.1%) also fell, with Woolworths weaker after cutting profit guidance.
More earnings updates will follow in early May as the major banks report and a key Australian investment conference takes place.
INTERNATIONAL EQUITIES
Global equities rebounded strongly in April, with the MSCI All-World Index up +8.3%.
US markets led the way, with the Nasdaq up +15.3%, the S&P 500 up +10.5% and the Dow Jones up
+7.2%.
US earnings for the March quarter have been solid, led by technology and financials and are tracking around 27% growth year-on-year.
US small caps also joined the rally, with the Russell 2000 rising +12.2%. Europe (+7.3%) and Japan (+5.9%) posted more moderate gains.
Emerging Markets (+10.4%) performed strongly, particularly those deeply embedded in the AI semiconductor supply chain (Taiwan and South Korea).
PROPERTY & INFRASTRUCTURE
After a softer March quarter, both Australian and global listed property bounced back strongly in April, rising +8.6% and +8.4% respectively.
Support came from tight supply, rising rents and attractive valuations, with many REITs trading below net tangible asset value.
Global Infrastructure gained +1.6%.
FIXED INCOME
The Bloomberg Australian Bond Index was flat in April.
Australian Government 10-year bond yields closed above 5% for the first time since 2011, as higher oil prices reignited inflation concerns.
The RBA increased the cash rate by 0.25% to 4.35% on 5 May, its third hike in 2026. This move fully unwinds the 0.75% of rate cuts made in 2025.
The RBA noted that higher fuel prices are feeding into broader inflation, with flow-on effects expected across goods and services. Higher interest rates are aimed at slowing demand to better align with supply.
Markets are now fully pricing in a further 0.25% rate rise by October 2026.